Student Surveys
The Student Survey tool enables the Tutor to get instant feedback from Students during or at the end of a session. The Tutor sends connected Students a question, together with a selection of pre-defined responses. Student responses are gathered at the Tutor with the results shown as an overall percentage and by individual Student. Results can be shown to Students in the form of a pie chart, Students must respond before they can view the results.
Students can also be temporarily 'grouped' by response enabling you to see in an instant who selected the same answer. This could be useful if you felt a quick follow-up question or message to particular Students was required.
Sending a survey to Students
-
Select the Survey View
 icon on the left-hand side of the Tutor Console.
Or
Select the View tab in the ribbon, click the drop-down arrow
 in the Mode section and choose Survey View.
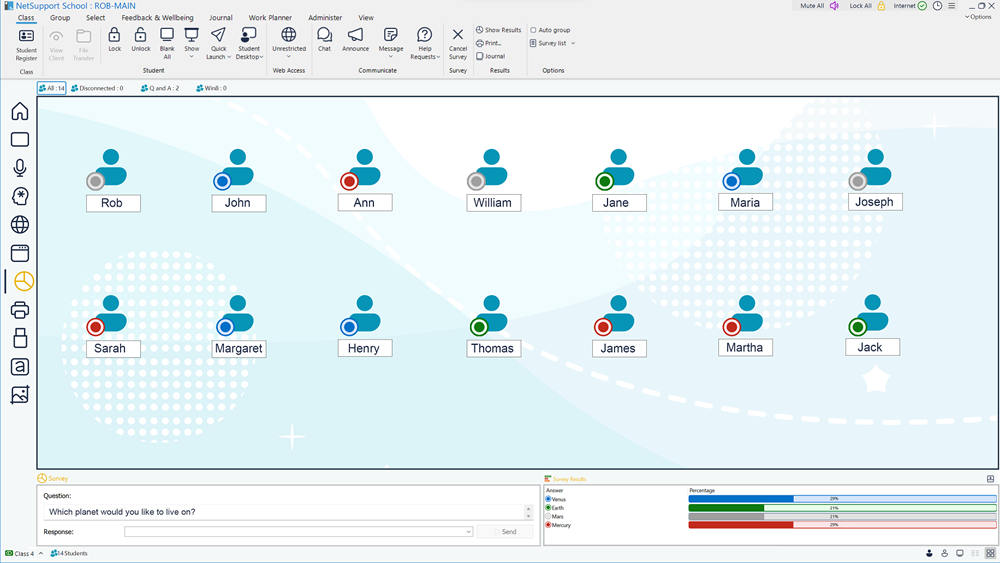
-
Select the Students to include in the survey.
 Displays the currently connected Students or groups. You can switch the display mode between large icons and details view from the View tab in the ribbon., the currently selected Students or a defined group of Students.
 -
Enter a question in the Survey pane Question field.
-
Select the responses/answers to the question. These can either be chosen from the Response drop-down list of defaults or you can enter your own options, using a comma to separate each one. Up to six choices can be entered.
Note: You can select a pre-defined survey from the Survey list by selecting the Class tab in the ribbon, clicking the Question icon and selecting the required survey. Pre-defined surveys can be selected from the Question drop-down arrow in the ribbon. -
Send the survey to Students by clicking Send in the Survey pane or selecting the Class tab in the ribbon and clicking Send.
-
A dialog appears at the Student machines displaying the question and responses. Students choose the appropriate response to submit their answer.
-
As Students submit their answers, the Survey Results pane will display the percentage response for each option. The Student icon will also flag how the individual Student answered. By switching the List view to details view (click the Details
 icon on the status bar), you can sort the Students by result.
 -
When the survey is complete, remove it from the screen by clicking Cancel Survey in the ribbon.
-
The survey will be cleared from all machines whether the Student has responded or not.
-
Once the question has been sent to Students, it will be added to the Survey list, allowing you to re-use this.
Show survey results to Students
-
Select the Class tab in the ribbon and click Show Results.
-
The results will be displayed as a pie chart on Students screens'.
Save survey results
The survey can be saved to a .CSV file.
-
Select the Class tab in the ribbon, click Survey list and choose Save from the drop-down menu.
Print survey results
Before clearing the survey, you can print a permanent record of the results.
-
Select the Class tab in the ribbon and click Print.
See also:
Creating and managing survey lists
